
The Apples & Oranges process is simple in concept, but rather more complex in execution. The idea is to take a player’s measurable production, as near as that can be determined, and compare it to what a typical team, in that player’s time and place, would accomplish.
Skill, value and production
Let me start by saying that I think (almost) all statistics are inherently useful, even RBI. Stats are information, and the more information we have available, the more sound our judgement is as analysts, or even just as fans. The key, of course, is to recognize exactly what a particular bit of information is telling us. Sticking to baseball, batting average tells us something very specific about a player — how often he hits safely when he attempts to do so. It is a measure of skill, but not static skill; it’s the batter’s skill relative to the pitchers he faces.
Batting average was once, along with RBI, one of the gold-standard statistics for measuring a ballplayer’s worth. It has been devalued in the estimation of modern statisticians (the modern era kicking off with Bill James’ work in the late ’70s), because it doesn’t correlate as well with a team’s run-scoring as other numbers do. RBI, for its part, went by the wayside because it doesn’t account for context. Unlike batting average, it is a measure of production, not skill. But the circumstances surrounding that production (most importantly, men on base) were not factored into the calculation.
Modern statistics are not concerned with skill or production. Since the focus of stats has moved from recording what happened to why it happened the operative principle is value, which is essentially production divided by opportunity. Value is of concern to team executives looking to make sure they are spending their money wisely. Value will tell you which young player is making the most of a limited opportunity, and which star is not justifying his paycheck.
Most publicly available advanced statistics measure dozens of factors to infinitesimal precision. They can tell you something as specific as how many points per possession Kyrie Irving and Al Horford generate on pick-and-roll plays, or as general as the total number of runs above replacement-level that Giancarlo Stanton has created in his career. Apples & Oranges isn’t nearly that exact. It’s deliberately backward-looking, descriptive rather than predictive, and concerned with production over value.
Where’s zero?
On the issue of context, most global stats use some sort of plus-minus system to rate players against their peers. Early on, the zero point was a league-average player; positive meant better than average, negative meant worse. The problem there is that, year-to-year, the positives and negatives tended to cancel each other out. A player could have a 15-year career hovering around league average and finish with a 0.0 rating, exactly the same as if he had never tried at all.
Now most systems compare performance to a theoretical “replacement-level” player, i.e. someone the team could get off the street and plug into the role. This moves most actual players into permanently positive territory, but still undervalues a portion of their career, and ties a good bit of that value in what the definition “replacement level” is.
Apples & Oranges doesn’t use plus-minus, but rather a ratio, dividing a player’s production by what an average team would accomplish. This way zero is zero, a player who does nothing gets nothing, while even tiny, incremental steps toward victory are noted. Going by team performance keeps the numbers from getting out of hand (you do not want to divide Micheal Jordan’s numbers by an average NBA player’s) and also keeps out of the blind alley in which shortstops have to be compared only to other shortstops, or quarterbacks to quarterbacks, instead of just player to player.
The nitty-gritty
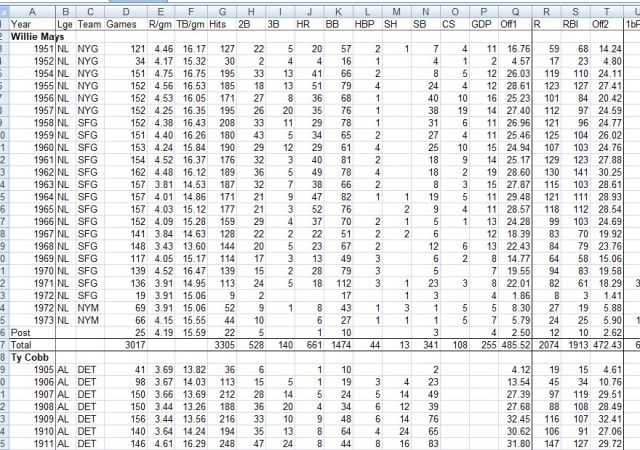
Each player is evaluated on a series of related, commonly accessible statistics. Generally, there are two measures for offense and two for defense. The player’s totals for a particular season are divided by the league’s per-game average for the same stats. Then the two offensive measures are averaged together, the same with the two defensive numbers, and then offense and defense get averaged to get a total for the season. Then the seasonal numbers add up for the career total, along with postseason or national-team games, which get compiled in a special “seasons” of their own.
I’ll use the phrase “games’ worth” a lot. It’s clumsy wording, but it’s the basic unit I’m using.
For example, in 1927, Babe Ruth had 192 hits, 29 doubles, 8 triples, 60 home runs, 137 walks, 14 sacrifice bunts, 7 stolen bases, and was caught stealing 6 times. That adds up to 569 total bases. The average American League team in 1927 had 17.47 total bases each game, so Ruth had 32.57 games’ worth on the first offensive measurement. The second offensive metric, based on runs scored and driven in, is 32.72, so his final offensive number 32.65 games’ worth of offense. Defense was 5.96, bringing the average to 19.30 overall. Add up his career (including 5.36 for his 41 postseason games) and it totals 299.85 games’ worth of production in 2544 games played.
That raw total still needs some massaging before we can compare baseball players, whose season is 10 times as long as the NFL’s, to their gridiron counterparts or other athletes. For this, Apples & Oranges cribs from “The New Bill James Historical Baseball Abstract,” where James looks at the same data from different angles to rate the players.
First, Apples & Oranges uses a per-game average, prorated to 160 games. That equals about one full baseball season, two NHL or NBA seasons, and 10 NFL seasons. The actual number is unimportant. The idea is to convert the per-game production into a number big enough to compare to the career figure.
The second factor is the square root of the lifetime total. Using the square root keeps the baseball players from lapping the field and gives diminishing returns to players who stuck around for a very long time.
For Babe Ruth, the 160-game average is 17.80 (adjusted a bit further because he was a pitcher early in his career), and the square root of the total is 17.32, giving him a final rating of 35.12. For comparison, Michael Jordan, playing 1251 games, had a final number of 36.27. Jim Brown, in 122 games, is at 31.36.
For the most productive positions in each sport, the best players come in with a final rating of about 23.00 and over; 25.00 is a hall-of-famer; over 30.00 is the best of the best. Certain positions (relief pitchers, NFL defenders, etc.) are inherently limited by tactics. Wide receivers simply don’t get the ball as often as running backs, for example, giving them fewer opportunities to impact the game. This does not mean that I think wide receivers are less “valuable” than running backs, or that they don’t work as hard, or that what they do isn’t as difficult, but they do operate with a different set of constraints on their productivity.
